Wichtige Erkenntnisse
- Diesel stieg in 12 Monaten um 50,2 %: Der nationale Durchschnitt erreichte 5,43 $ pro Gallone und näherte sich damit dem Allzeitrekord von 5,81 $, der während der Russland-Ukraine-Krise im Juni 2022 aufgestellt wurde. Aber die landesweite Zahl verbirgt den wahren Schmerz.
- Die Lücke von 3,03 $: Kalifornien zahlt 7,52 $ pro Gallone. Oklahoma zahlt 4,49 $. Gleicher Treibstoff, gleicher Krieg, gleiches Land. Klimapolitik auf Landesebene erhöht die Kriegsprämie in den am stärksten betroffenen Staaten um 40 bis 60 Cent pro Gallone.
- Diesel ist die unsichtbare Steuer: Der Großteil der US-Frachttonnage wird davon angetrieben. Ein Dieselanstieg von 50 % bleibt nicht auf der Raststätte. Es durchdringt die Lieferkette bis hin zu jedem Produkt in jedem Regal.
- Kleine Transportunternehmen sind der Kanarienvogel: Der Großhandelsdiesel stieg in einer einzigen Woche um mehr als 30 %, die größte Störung seit der russischen Invasion in der Ukraine. Eigentümer-Betreiber können sich nicht absichern. Treibstoffzuschläge bleiben hinter der Realität zurück. Die Insolvenzen von Fluggesellschaften folgen Treibstoffspitzen wie am Schnürchen.
Der Preis, den Sie nie überprüfen
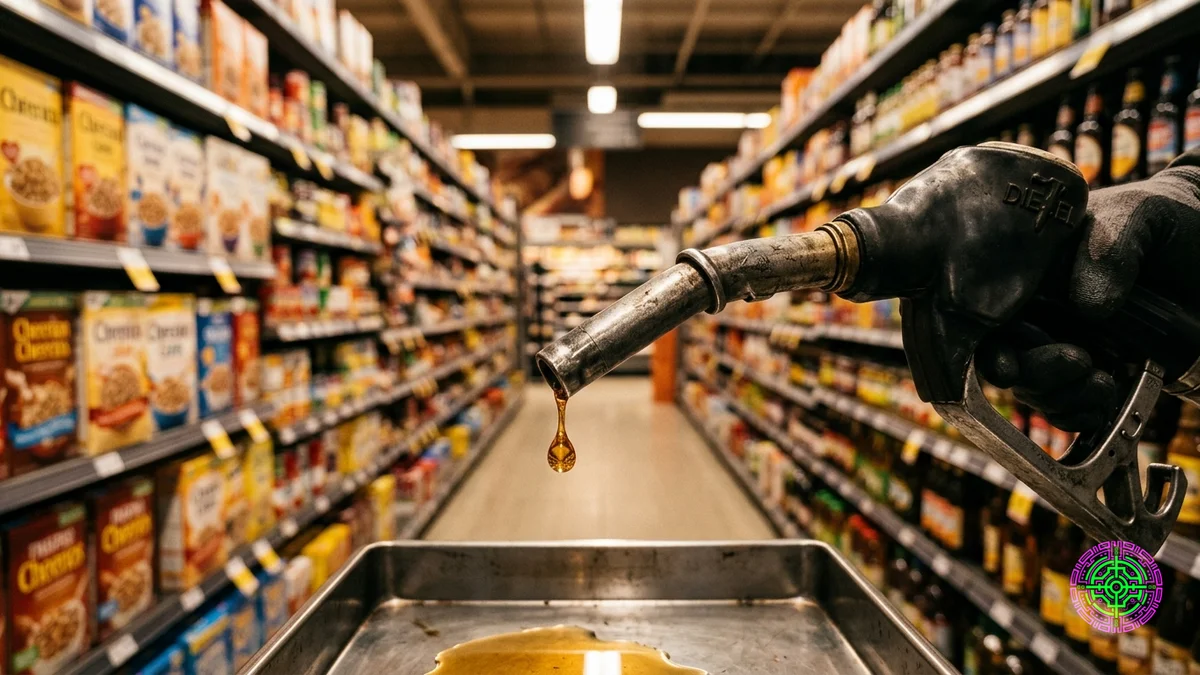
Überprüfen Sie Ihren letzten Lebensmittelbeleg. Suchen Sie die Zeile mit der Aufschrift „Dieselzuschlag“. Es ist nicht da. Das ist der Punkt.
Diesel ist kein Benzin. Die meisten Amerikaner pumpen es nie. Aber Diesel treibt den LKW an, der das Getreide zu Ihrem Regal transportiert hat, den Traktor, der den Weizen geerntet hat, den Generator, der die Kühlkette intakt hielt, und den Güterzug, der den Container vom Hafen transportiert hat. Wenn Diesel von 3,62 $ auf 5,43 $ pro Gallone steigt, was einem Anstieg von 50,2 % in 12 Monaten entspricht, verschwinden diese Kosten nicht an der Laderampe. Es fließt in jede Frachtrechnung, jeden Treibstoffzuschlag und jede Großhandelspreisverhandlung zwischen hier und Ihrem Küchentisch ein.
Und $5,43 ist der Durchschnitt. Die nationale Nummer glättet die Orte, an denen Diesel bereits ein Notfall ist.
Die Karte, auf die niemand schaut
Vergessen Sie für eine Minute den Öl-Futures-Chart. Die wahre Geschichte ist die Kluft zwischen den Staaten.
| Staat | Diesel ($/gal) | Veränderung gegenüber dem Vorjahr |
|---|---|---|
| Kalifornien | $7,52 | +49,7 % |
| Hawaii | $6,73 | +27,3 % |
| Washington | $6,67 | +49,7 % |
| Nevada | $6,22 | +62,5 % |
| Arizona | $6,04 | +68,8 % |
| Nationaler Durchschnitt | $5,43 | +50,2 % |
| Kansas | $4,56 | +39,2 % |
| Oklahoma | $4,49 | +42,6 % |
Das ist eine Spanne von 3,03 $ zwischen den teuersten und günstigsten Bundesstaaten. Ein Trucker, der in Tulsa einen 150-Gallonen-Tank füllt, zahlt 673 $. Die gleiche Tankfüllung in Los Angeles kostet 1.128 $, ein Unterschied von 455 $ für den gleichen Diesel, im gleichen Land, während des gleichen Krieges.
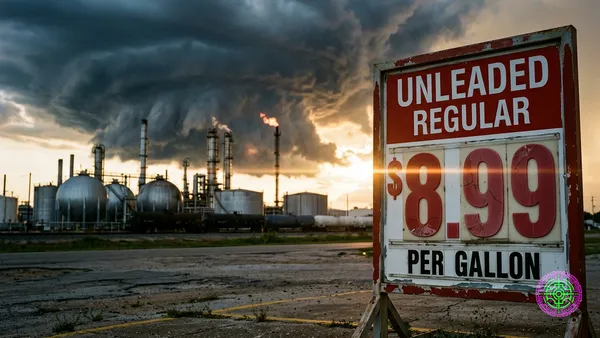
Der bisherige nationale Allzeitrekord, der während des Russland-Ukraine-Schocks im Juni 2022 aufgestellt wurde, lag bei 5,81 $. Fünf Bundesstaaten haben es bereits hinter sich gelassen: Kalifornien, Hawaii, Washington, Nevada und Arizona. Der nationale Durchschnitt hat den Rekord von 2022 technisch gesehen nicht gebrochen. Aber fünf Staaten mit fast 60 Millionen Einwohnern zahlen bereits mehr als in der schlimmsten Woche der letzten Energiekrise.
Die $0,96-Woche
Die Geschwindigkeit dieser Spitze ist der Teil, der Dinge kaputt macht.
Am 2. März lag der wöchentliche nationale Dieseldurchschnitt der EIA bei 3,90 $ pro Gallone. Am 9. März lag er bei 4,86 $, ein Anstieg von 0,96 $ innerhalb von sieben Tagen. Am 30. März lag der Wert bei 5,40 $.
Die Ursache liegt auf der Hand: Der Iran-Krieg hat die Straße von Hormus geschlossen, wodurch rund 20 Millionen Barrel pro Tag aus dem weltweiten Transport entzogen wurden. Die Großhandelspreise für Diesel stiegen in einer einzigen Woche um mehr als 30 %. Der Spread zwischen Einzelhandel und Großhandel (die Marge, mit der Tankstellen die Volatilität absorbieren) verringerte sich von 1,02 $ auf 0,68 $ pro Gallone. Die Tankstellen konnten die Preise nicht schnell genug erhöhen, um mit ihren eigenen Ersatzkosten Schritt zu halten.
FreightWaves nannte es die bedeutendste Kraftstoffstörung seit der russischen Invasion in der Ukraine Anfang 2022 und die erste groß angelegte Störung seit der OPEC-Beschränkung der Versorgung Mitte 2023.
21 % jeder Meile
Hier ist der Mechanismus, der einen Tanker im Persischen Golf mit einem Preisschild in Peoria verbindet.
Laut C.H. macht Dieselkraftstoff etwa 21 % der Gesamtkosten pro Meile im Lkw-Verkehr aus. Robinsons Frachtmarktanalyse vom März 2026. FreightWaves beziffert den breiteren Bereich auf 20–25 % der gesamten Transportkosten für LKW-Ladungen. So oder so: Wenn der Dieselanteil 50 % beträgt, wird er von der Fracht nicht stillschweigend absorbiert.
Der Übertragungsmechanismus ist der Treibstoffzuschlag, ein Posten auf Frachtrechnungen, der sich an die Dieselpreise anpasst. Theoretisch machen Zuschläge die Spediteure komplett. In der Praxis hinken sie hinterher. Bei den meisten Aufpreistabellen werden die Preise wöchentlich neu berechnet, wobei von einer Effizienz von 6,5–7 Meilen pro Gallone ausgegangen wird. Wenn Diesel in einer Woche um einen Dollar steigt, holt der Zuschlag am nächsten Montag auf. Der Spediteur frisst die Lücke bei jeder Ladung fünf bis sieben Tage lang.
Für große Flotten mit Absicherungsprogrammen und Großkraftstoffverträgen ist dies beherrschbar. Für Eigentümer und Betreiber, die Einzel-Lkw-Unternehmer, die an der Zapfsäule bar bezahlen, ist es existenziell. Sie füllen den Tank zum Preis dieser Woche, transportieren die Ladung zum Preis der letzten Woche und beten, dass die Rechnung am Ende des Monats aufgeht.
Das ist oft nicht der Fall. C.H. Robinsons Analyse stellt fest, dass Treibstoffspitzen historisch mit Insolvenzen von Fluggesellschaften einhergehen. Als Diesel das letzte Mal im Juni 2022 diese Werte erreichte, verließen innerhalb weniger Monate Tausende kleiner Transportunternehmen den Markt. Das gleiche Muster bildet sich jetzt heraus.
Wer hat das Streichholz angezündet?
Lassen Sie uns die Kausalität genauer betrachten. Am 27. Februar 2026 war die Straße von Hormus geöffnet. Tanker waren unterwegs. Diesel kostete landesweit 3,90 $ pro Gallone.
Dann griffen die Vereinigten Staaten den Iran an (/markets/open-the-strait-trump-bombed-it-shut). Die Meerenge wurde geschlossen. Der Dieselpreis liegt jetzt bei 5,43 $, Tendenz steigend.
Dabei handelt es sich nicht um ein „Marktereignis“ oder einen „exogenen Schock“. Dies ist eine direkte, nachvollziehbare Folge eines Krieges, den diese Regierung begonnen hat. Jeder Penny des Anstiegs um 1,81 US-Dollar gegenüber dem Vorjahr ist auf eine in Washington, D.C. getroffene politische Entscheidung zurückzuführen: keine Naturkatastrophe, keine Manipulation der OPEC (Organisation erdölexportierender Länder), kein Raffinerieunfall. Ein Krieg der Wahl schloss den Engpass, an dem täglich 20 Millionen Barrel Öl transportiert wurden, und die Preise für den Transport von Waren in Amerika stiegen als Reaktion darauf um 50 %.
Die vorhersehbare Ablenkung ist bereits im Gange. Konservative Medien werden Kaliforniens Cap-and-Trade dafür verantwortlich machen. Sie werden Washingtons Climate Commitment Act dafür verantwortlich machen. Sie zeigen auf den kalifornischen Preis von 7,52 US-Dollar und sagen: Sehen Sie? Blue State Policen haben dies getan.
Die Daten erzählen eine andere Geschichte. Oklahoma (kein Cap-and-Trade, kein Standard für kohlenstoffarme Kraftstoffe, freundliches regulatorisches Umfeld) zahlt 4,49 $ pro Gallone. Das ist immer noch eine Steigerung von 42,6 %. Kansas, gleiches Angebot: plus 39,2 %. Wyoming: 4,99 $. Jeder Staat des Landes zahlt mehr für Diesel, weil die Meerenge gesperrt ist. Der Krieg ist die Basis. Alles andere ist ein Einzelposten.
Die Verbreitung auf Landesebene
Ja, die staatliche Politik macht es mancherorts noch schlimmer. Staaten mit Cap-and-Trade-Programmen und Standards für kohlenstoffarme Kraftstoffe zahlen schätzungsweise 40 bis 60 Cent pro Gallone mehr als ihre Nachbarn. Kaliforniens Regulierungspaket (Standards für kohlenstoffarme Kraftstoffe, Cap-and-Trade, staatliche Verbrauchssteuern) führt mit 7,52 $ zum höchsten Preis des Landes.
Diese Prämien sind real. Sie existierten vor dem Krieg. Aber sie sind nicht der Grund, warum Diesel in diesem Frühjahr Rekordwerte erreichte. Diesel war mit 3,90 $ zuzüglich einer staatlichen Prämie erschwinglich. Diesel ist ein Notfall für 5,43 $ zuzüglich der gleichen Prämie. Die Prämie hat sich nicht geändert. Die $5,43 haben es getan. Und diese 5,43 $ haben einen Autor.
Wer zahlt
Der Schaden verteilt sich ungleichmäßig.
Bauern werden auf beiden Seiten getroffen. Diesel treibt den Traktor, den Mähdrescher, den Getreidetransporter und das Düngemittellieferfahrzeug an. Der durchschnittliche Dieselpreis für US-amerikanische Landwirte erreichte am 31. März 5,40 $ pro Gallone, ein Anstieg von 1,81 $ gegenüber dem Vorjahr. An der Westküste ist die Dieselrechnung für die Landwirtschaft um 1–2 $ pro Gallone höher. Das ist, bevor man den Düngemittelschock mitzählt, der die Inputkosten aus der anderen Richtung trifft.
Kleine Speditionen sind am stärksten betroffen. Da Treibstoff 20 bis 25 % der Gesamtkosten einer LKW-Ladung ausmacht, bedeutet ein Dieselanstieg um 50 % einen Anstieg der gesamten Frachtkosten um 10 bis 12 %. Die Mathematik bricht schnell. Die Grundtarife in vielen Vertragsfrachtverträgen wurden unter der Annahme einer Einzelhandels-Großhandelsspanne von etwa 1,20 $ pro Gallone strukturiert; Der aktuelle Spread von 0,68 $ bedeutet, dass selbst Anbieter mit Zuschlägen nicht vollständig abgedeckt sind.
Verbraucher zahlen zuletzt und bemerken es am wenigsten. Der Dieselzuschlag erscheint nicht auf einem Lebensmittelbeleg. Es scheint ein etwas höherer Preis für Müsli, eine etwas höhere Liefergebühr bei Amazon und eine etwas höhere Miete von einem Vermieter zu sein, dessen Unterhaltskosten gestiegen sind. Die Verzögerung zwischen der Pumpe und dem Regal beträgt je nach Produkt Wochen bis Monate. Der März-Spitzenwert wird Ihre Lebensmittelrechnung im Mai erreichen.
Das Muster
Dies ist der zweite große Dieselschock in vier Jahren.
Der Anstieg zwischen Russland und der Ukraine im Jahr 2022 erreichte im Juni landesweit seinen Höhepunkt bei 5,81 US-Dollar. Dieser Schock trug zu den höchsten Werten des Verbraucherpreisindex (VPI) seit 40 Jahren bei, zwang die Federal Reserve zu dem aggressivsten Zinserhöhungszyklus seit der Volcker-Ära und brachte die Wirtschaft an den Rand einer Rezession. Die Diesel-Inflation-Pipeline ist nicht theoretisch. Es ist jüngste Geschichte.
Diesmal hat die nationale Zahl die 5,81-Dollar-Marke noch nicht geknackt. Aber die Spitzenwerte auf Landesebene sind beispiellos. Kalifornien liegt mit 7,52 $ ganze 1,71 $ über dem nationalen Rekord von 2022. Washington liegt mit 6,67 USD 86 Cent darüber. Und anders als im Jahr 2022, als die Straße von Hormus offen blieb und russisches Öl innerhalb weniger Monate alternative Abnehmer fand, gibt es bei der aktuellen Schließung [kein ausgehandeltes Auslassventil] (/energy/how-iran-wins-a-war-its-losing). Der Iran sagt, die Meerenge bleibe geschlossen, bis die Kriegsschäden bezahlt seien.
Die Dauer der Unterbrechung der Schifffahrt durch die Straße von Hormus, wie C.H. Robinson nennt es „den Swing-Faktor“. Wenn die Meerenge im Sommer wieder geöffnet wird, zieht sich der Diesel zurück. Wenn dies nicht der Fall ist, wird der nationale Durchschnitt den Rekord von 2022 brechen, und die Staaten, die bereits darüber liegen, werden in ein Gebiet vorstoßen, das niemand vorhergesehen hat.
Die Steuer, für die niemand gestimmt hat
Diesel ist die Basisschicht der amerikanischen Preisklasse. Es erscheint weder auf einem Stimmzettel noch auf einer Quittung. Es zeigt sich in der Lücke zwischen dem, was die Dinge im letzten Jahr gekostet haben, und dem, was sie jetzt kosten.
Ein 50-prozentiger Anstieg des Treibstoffs, der den Großteil des US-amerikanischen Konsums bewegt, ist keine Geschichte vom Ölmarkt. Es ist eine Alles-Markt-Geschichte. Und im Gegensatz zu früheren Energiekrisen (bei denen die Schuld auf OPEC-Entscheidungen, Störungen durch Hurrikane oder Unterinvestitionen in Raffinerien verteilt werden konnte) hat diese einen klaren Ursprung. Die Straße von Hormus war offen. Diese Regierung entschied sich für einen Krieg. Die Meerenge wurde geschlossen. Diesel stieg an. Das Gütersystem hat es absorbiert. Und jetzt arbeitet es sich in jedes Regal des Landes vor.
Der Abstand von 3,03 US-Dollar zwischen Oklahoma und Kalifornien ist real, und die Politik auf Landesebene erklärt einen Teil davon. Aber der Anstieg um 1,81 US-Dollar im Jahresvergleich, der jeden Bundesstaat, Rot, Blau und Lila, betraf, hat einen Grund.
Der Diesel ist bereits im Güterverkehr. Die Zuschläge sind bereits auf den Rechnungen ausgewiesen. Die Regalpreise haben einfach noch nicht aufgeholt.
Das werden sie.
Quellen
- EIA: Weekly U.S. No 2 Diesel Retail Prices
- SmartAsset: Gas Prices Hit Records in 2026 — State by State Breakdown
- MyNorthwest: Washington Sets All-Time Diesel Price Record in 2026
- FreightWaves: Rapid Fuel Price Jump Hits Transportation Hard
- C.H. Robinson: March 2026 Diesel Fuel Market Update
- S&P Global: US Corn, Soybean Farmers Face Rising Fertilizer, Fuel Costs
- KIRO 7: Washington Sets All-Time Diesel Price Record
- Supply Chain Dive: Diesel Surge Slows but California Costs Still Swell
🦋 Discussion on Bluesky
Discuss on Bluesky