Key Takeaways
- The 3.8% print: April 2026 headline CPI rose 0.6% on the month and 3.8% over the year, the highest annual reading since May 2023.
- Core re-accelerated: Core CPI rose 0.4% on the month, double March’s 0.2% pace, and 2.8% year-over-year, with both figures above economist forecasts of 0.3% and 2.7%.
- Real wages turned negative: Real average hourly earnings fell 0.5% on the month and 0.3% over the year, the first annual decline in three years.
- The shock broadened: Energy still drove over 40% of the monthly increase, but shelter at 0.6% and food at 0.5% mean the price pressure is no longer a single-commodity story.
What Happened
At 8:30 a.m. Eastern on May 12, 2026, the Bureau of Labor Statistics released the April Consumer Price Index report. Headline CPI rose 0.6% on the month, seasonally adjusted, and 3.8% over the prior twelve months, not seasonally adjusted. That annual reading is the highest since May 2023.
Alongside it, the BLS released the companion Real Earnings report. Real average hourly earnings, the BLS measure of nominal pay adjusted for the same CPI, fell 0.5% on the month and 0.3% over the year. Bloomberg’s wire framed it as the first inflation-adjusted wage decline in three years.
Two BLS releases. Same morning. One says the dollar is shrinking faster than the Fed wants. The other says American paychecks just lost the race to keep up.
Key Details
| Metric | April 2026 | Context |
|---|---|---|
| Headline CPI, month-over-month (SA) | +0.6% | Slower than March’s +0.9% |
| Headline CPI, year-over-year (NSA) | +3.8% | Highest since May 2023 |
| Core CPI, month-over-month (SA) | +0.4% | Double March’s +0.2% pace |
| Core CPI, year-over-year | +2.8% | Above 2.7% forecast |
| Energy index, month-over-month | +3.8% | Over 40% of all-items increase |
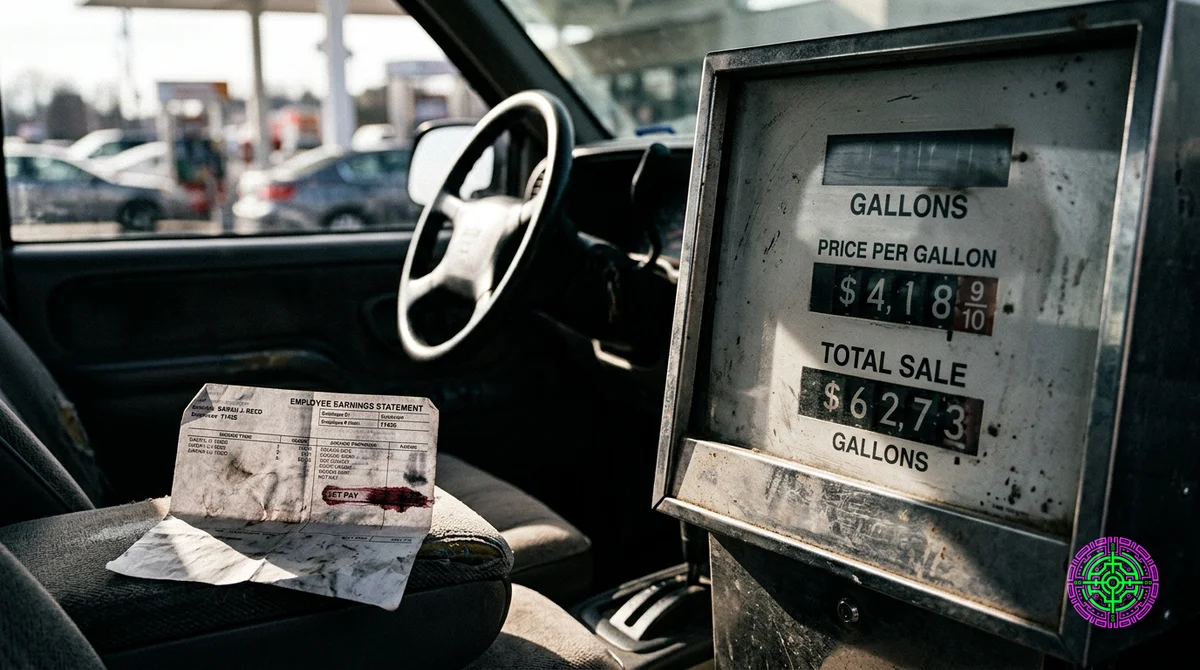
| Gasoline, month-over-month | +5.4% | Up 28.4% year-over-year |
| Food, month-over-month | +0.5% | Food at home +0.7% |
| Shelter, month-over-month | +0.6% | Year-over-year +3.3% |
| Real avg hourly earnings, YoY | -0.3% | First annual decline in three years |
The shape of the print matters more than the headline number. In March, gasoline alone did roughly three-quarters of the work. In April, the energy complex still led with 40%-plus of the monthly all-items increase, but core CPI doubled its monthly pace at the same time. Shelter ran at 0.6%, food at 0.5%, and the slower-moving services categories began catching up to the energy line that ripped first.
Why It Matters
For Consumers
The arithmetic is the headline:
Nominal hourly earnings held near the 3.5% annual pace the BLS reported for March, but headline inflation jumped 50 basis points to 3.8%. Real pay is now running behind prices. CNN’s coverage of the report described the data as “eroding Americans’ paychecks.”
This is the inflection the March CPI article on this site flagged as the next data point to watch. The March 2026 CPI analysis closed with a real-wage buffer of plus-twenty basis points and called the cushion a “rounding error.” The April release crossed it.
For the Industry
Bond and rate desks are reading two facts off the same page. The first is that headline inflation accelerated despite a slower monthly pace, which means the year-over-year trajectory is still rising. The second is that core CPI doubled its monthly pace and beat forecasts, a pattern consistent with second-round pass-through from energy to services, though one month of correlation is not proof of causation.
The May 8 University of Michigan preliminary sentiment index already landed at 48.2, a record low, with the survey attributing the drop to inflation concerns. Consumers were pricing this print before it dropped.
The European mirror image is sharper. A Bloomberg survey of ECB watchers reported the European Central Bank is now expected to hike rates twice in 2026, on the same oil shock the Fed is being pushed to cut into. Two central banks. One commodity input. Opposite responses.
For Investors
The Fed’s “no landing” path looked like a base case by March. After April, it looks like the only case the data supports without explicit political pressure. The 1994 Bond Massacre Redux piece modeled the curve repricing that follows when rate-cut expectations collapse into a hot core print. April delivered the hot core print.
Watch the energy sector winners. Gasoline at +28.4% year-over-year is a direct revenue line for integrated oil. The wealth transfer from median commuters to energy shareholders that the 63-minute dollar analysis described as a 30-day version of a 35-year inequality trend is now running into its second consecutive monthly print.
The Backstory
The physical cause is upstream of the data. On March 13, 2026, US forces hit more than 90 Iranian military sites on Kharg Island, the terminal that handles the overwhelming share of Iran’s oil exports. The retaliatory spiral pushed Brent crude past $115 a barrel and drove US gasoline toward $4 a gallon by late March. That history is covered in depth in the Kharg Island strike analysis.
March’s CPI was the opening month of that shock showing up in official data. The Phantom CPI piece from February flagged a “spring surprise” scenario in which the 43-day government shutdown’s carry-forward distortion was holding the print artificially low through April 2026, with the unwinding bias roughly 0.25 to 0.30 percentage points. The shock arrived in March as a gasoline spike. It widened in April as core picked up.
The Counterargument
The strongest case against the alarming reading of this print is that the monthly pace slowed. March came in at +0.9% month-over-month; April came in at +0.6%. Gasoline went from +21.2% on the month to +5.4%. By those measures, the worst of the pass-through is behind.
That reading would be more convincing if core CPI had not doubled its monthly pace in the same window. The pattern that worries bond desks is exactly this: headline cools as the commodity shock fades, but the second-order pass-through into shelter, services, and food keeps the underlying trend elevated. That is how a transitory commodity event becomes a sticky services event. The April core number is the early signature of that transition, not the end of it.
What’s Next
- May FOMC statement language: Watch for whether the committee characterizes the energy pass-through as “transitory” or as a risk to the inflation outlook. Transitory framing preserves optionality for cuts later in 2026. Risk framing kills the curve.
- May 2026 CPI, released mid-June: The next print covers a full month of post-shock gasoline normalization, if Brent eases. If the headline does not retreat materially while core keeps re-accelerating, the “stuck” regime is confirmed.
- Q2 retail earnings: A negative real-wage YoY print should show up early in discretionary spending. Mid-tier apparel, casual dining, and entry-level auto are the canaries.
- ECB June meeting: If Frankfurt hikes while the Fed is being pushed to cut, the dollar repricing imports inflation back into the next CPI print through the energy and import-price channels.
The Bottom Line
The April CPI print is the moment the Iran-war oil shock stopped being a gasoline story and started being a paycheck story. Headline inflation hit 3.8%, the hottest annual reading in nearly three years. Core CPI doubled its monthly pace and beat forecasts. Real average hourly earnings fell for the year for the first time since the post-pandemic inflation wave.
A central bank cannot cut into accelerating core inflation without re-anchoring expectations higher, and it cannot ignore a record-low consumer sentiment print without admitting it sees a slowdown the labor data has not yet confirmed. The political clock and the policy clock are now running on different calendars. The April print is what they look like when they disagree out loud.
Sources
- BLS: Consumer Price Index Summary April 2026
- BLS: Consumer Price Index April 2026 PDF
- BLS: Real Earnings April 2026
- Fox Business: CPI Inflation April 2026
- CNN: US inflation rose to 3.8% in April eroding paychecks
- CNBC: CPI inflation April 2026
- Kiplinger: CPI Report April 2026
- Bloomberg: US inflation accelerates in April
- Bloomberg: US consumer sentiment record low inflation angst
- Bloomberg: ECB rate hikes 2026 survey
- Wikipedia: 2026 Kharg Island attack
- CNBC: CPI inflation report March 2026

🦋 Discussion on Bluesky
Discuss on Bluesky